Extracting dataframes#
The results of a fit can be extracted from the Fitter object in the format of a Pandas DataFrame. Aside from the results themselves, the additional statistics from the fitting can also be extracted in a separate DataFrame.
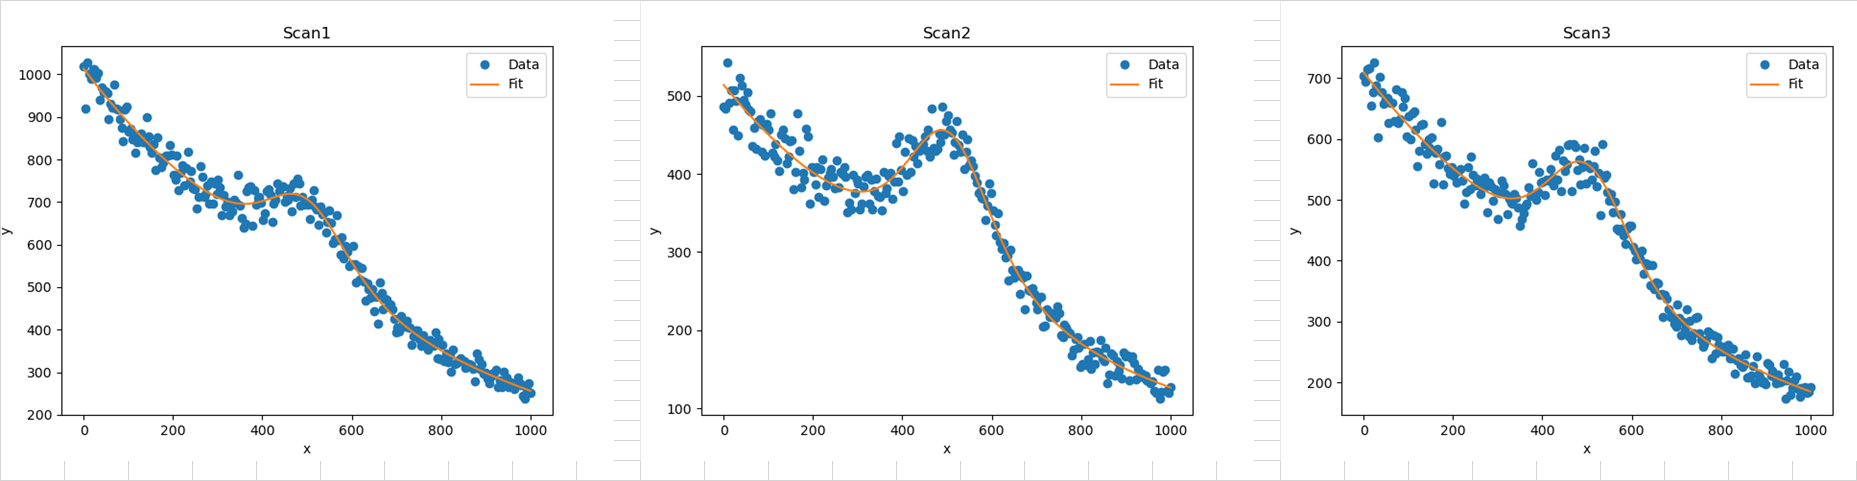
This will be demonstrated by fitting multiple spectra of a Voigt peak on top of an exponential background:
import sys

sys.path.insert(0, '..\src')
from io import BytesIO

import matplotlib.pyplot as plt
import numpy as np
import pandas as pd

import satlas2


def modifiedSqrt(input):
    output = np.sqrt(input)
    output[input <= 0] = 1
    return output


def createModels(backg, lamda, loc, fwhmg, fwhml, amp):
    bkg = satlas2.ExponentialDecay(backg, lamda, name='Background')
    peak = satlas2.Voigt(amp, loc, fwhmg, fwhml, name='Signal')
    return peak, bkg
Defining the parameters and preparing the needed arrays for saving the results:
loc = 500

fwhmg = 150
fwhml = 150
amp = 200

bkg1 = 1000
bkg2 = 500
bkg3 = 700

lamda = 500

rng = np.random.default_rng(0)

x = np.linspace(0, 1000, 250)
bkgs = [bkg1, bkg2, bkg3]
names = ['Scan1', 'Scan2', 'Scan3']

metadata = []
results = []
imgdatas = []
In a loop, generate three different datasets and fit them separately. The plots are saved to a BytesIO object for saving to an Excel spreadsheet later.
for bkg, name in zip(bkgs, names):
    peakm, bkgm = createModels(bkg, lamda, loc, fwhmg, fwhml, amp)

    y = satlas2.generateSpectrum([peakm, bkgm], x, rng.poisson)

    fig = plt.figure()
    ax = fig.add_axes([0.1, 0.1, 0.8, 0.8])
    ax.plot(x, y, 'o', label='Data')
    ax.set_xlabel('x')
    ax.set_ylabel('y')
    datasource = satlas2.Source(x, y, yerr=modifiedSqrt, name=name)
    datasource.addModel(peakm)
    datasource.addModel(bkgm)
    f = satlas2.Fitter()
    f.addSource(datasource)
    f.fit()
    ax.plot(datasource.x, datasource.f(), label='Fit')
    ax.set_title(name)
    ax.legend(loc=0)
    metadata.append(f.createMetadataDataframe())
    results.append(f.createResultDataframe())

    imgdata = BytesIO()
    fig.savefig(imgdata, format='png')
    imgdatas.append(imgdata)

metadata = pd.concat(metadata)
results = pd.concat(results)
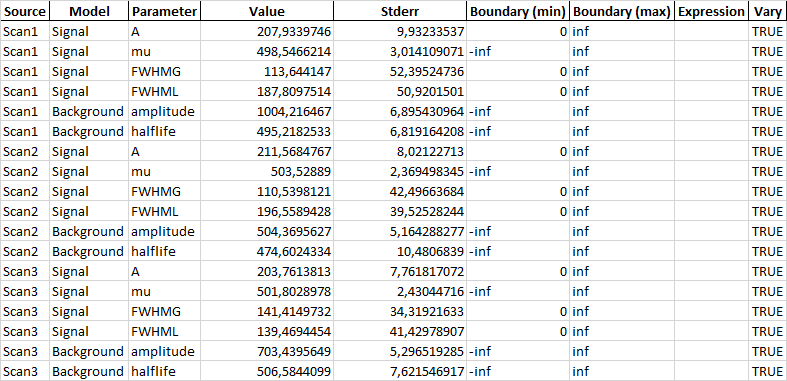
The metadata and results DataFrames now contain the fitting statistics and parameter results of all three fits respectively. As an example of how this can be processed later, the DataFrames along with the plots will be saved to an Excel sheet in the following section:
filename = 'test.xlsx'
figwidth = 10  # Standard figure size is about 10 cells

with pd.ExcelWriter(filename, engine='xlsxwriter') as writer:
    metadata.to_excel(writer, sheet_name='Metadata', index=False)
    results.to_excel(writer, sheet_name='Results', index=False)
    workbook = writer.book
    red_format = workbook.add_format({
        'bg_color': '#FFC7CE',
        'font_color': '#9C0006'
    })
    green_format = workbook.add_format({
        'bg_color': '#C6EFCE',
        'font_color': '#006100'
    })
    yellow_format = workbook.add_format({
        'bg_color': '#FFEB9C',
        'font_color': '#9C5700'
    })

    metadatasheet = workbook.get_worksheet_by_name('Metadata')
    resultssheet = workbook.get_worksheet_by_name('Results')
    figuressheet = workbook.add_worksheet('Figures')
    for i, im in enumerate(imgdatas):
        im.seek(0)
        figuressheet.insert_image(0, 0 + i * 10, "", {'image_data': im})

    # Add conditional formatting to illustrate reduced chisquares that
    # are above the 1-sigma estimate for the reduced chisquare
    metadatasheet.conditional_format(
        'H2:H99', {
            'type': 'cell',
            'criteria': 'not between',
            'minimum': '=1-SQRT(2/(E2:E99-F2:F99))',
            'maximum': '=1+SQRT(2/(E2:E99-F2:F99))',
            'format': yellow_format
        })
    metadatasheet.conditional_format(
        'H2:H99', {
            'type': 'cell',
            'criteria': 'between',
            'minimum': '=1-SQRT(2/(E2:E99-F2:F99))',
            'maximum': '=1+SQRT(2/(E2:E99-F2:F99))',
            'format': green_format
        })
    try:
        metadatasheet.autofit()
        resultssheet.autofit()
    except:
        pass
This results in an Excel sheet with the first sheet looking like this:

The second sheet contains the parameter results:
And the third sheet contains figures of the three datasets: